

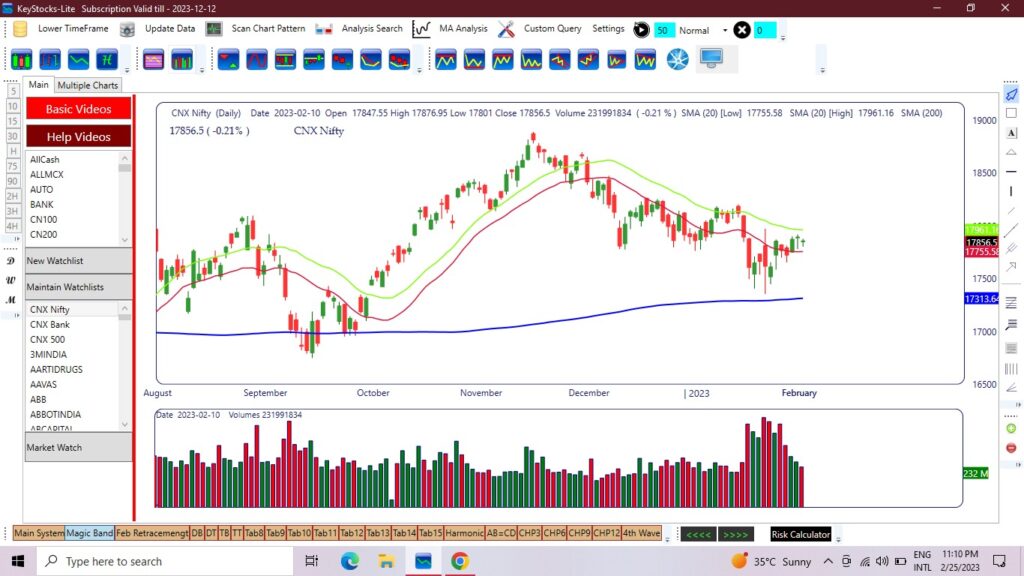
Magic Band Strategy is a technical indicator where we can analyze stocks before trading. It consists of 3 bands: 20 moving average high , 20 moving average low and 200 moving average closing value. It is very useful for swing trading.
Hey, are you facing loss in stock market in recent times? or facing issues with your stocks? Most of the beginner investors of stock market or even experienced investors face loss in stock market. In Most of the cases is due to lack of knowledge about trading indicator strategy magic band strategy and after losing stocks you might feeling little less motivated or want to quit the stock market.
Selecting Stocks Using Magic Band Strategy:
Let understand how to select stock for medium investment by using magic band. To make a magic band we will use 3 simple moving average(SMA). At first We will take two 20 moving average and then one 200 moving average. Let’s make a magic band first.
[articleAdToAppear]
Step (1) :- Open your dement account > Select any stock > Go to the indicator option > select Moving Average > click on the Moving Average > Click on setting > Go to inputs > change length and source into 20 and Low.
Step (2) :- Open your dement account > Select any stock > Go to the indicator option > select Moving Average > click on the Moving Average > Click on setting > Go to inputs > change length and source into 20 and High.
Step (3) :- Open your dement account > Select any stock > Go to the indicator option > select Moving Average > click on the Moving Average > Click on setting > Go to inputs > change length and source into 200 and Close.
Your magic band is now ready to use.
3 Bands of Magic Band Strategy:
Magic band consists of 3 bands: 1) 20 moving average band high, 2) 20 moving average band low and 3) 200 moving average closing value
20 moving average high:
If we take 20 days high values and make average of that values, we will get 20 moving average high value. If it goes to high with other bands, Its a strong bullish signal.
20 moving average low:
If we take 20 days low values and make average of that values, we will get 20 moving average low value. If it goes to high with other bands, Its a strong bullish signal.
200 moving average closing values:
If we take 200 days closing values and make average of that values, we will get 200 moving average closing value. If it goes to high with other bands, Its a strong bullish signal.
Strategy-
Thumb rule:- (1) All three moving average should be rising high so it will be a bullish signal, (2) Price should take support on the magic band in daily chart. (3) Buy above the high, stop loss below the low and target will be 1:5.
Let’s understand with an image
When to buy stocks:
When the strategy of magic band is going right, we need to follow the following rules to buy stocks.
- You need to buy stock above the high of last candle
- You need to make stop loss below the low
- Your target will be the last swing high.
If you want to learn magic band strategy more clearly, trading view writes a good article on this topic.
This is time to implement magic band strategy to get the best profit from the market. Remember, knowledge is nothing without implementation. So implement and analyze market always so that you can maximize your profit from the market. Execution is the first step to success. Investing or trading a practical field so implement right now!
If you have learned a new strategy, don’t forget to share the content with all traders. If you are value investor, then 2023 is the biggest opportunity for you. You can invest on IT sector and here is why?
Frequently Asked Questions:
Q) What is magic band in stock market?
Magic Band is a trading indicator for swing investment. It consists of 3 bands: 1) 20 moving average high, 2) 20 moving average low, 3) 200 moving average closing value.
Q) How do you use magic bands?
Thumb rule of using magic band strategy:- (1) All three moving average should be rising high so it will be a bullish signal, (2) Price should take support on the magic band in daily chart. (3) Buy above the high, stop loss below the low and target will be 1:5.
[multiplexAdToAppear]