
Hammer candlestick and doji are very popular candlestick patterns that investor use it for trading. If you are new to investing or trading, or you don’t have an advanced idea of how to use hammer candlestick and doji, then this article is for you. I will discuss all about hammer and doji candlestick pattern in this article and the rules that you should follow before trading.
Are you facing loss in stock market in recent times? or facing issues with your stocks? Most of the beginner investors of stock market or even experienced investors face loss in stock market. In Most of the cases is due to lack of knowledge about candlestick patterns like Hammer or Doji and after losing stocks you might feeling little less motivated or want to quit the stock market.
The person who gains from their slip-ups will win the market certainly however the person who doesn’t comprehend the mix-ups won’t gain from his encounters. I was also facing huge losses in stock market but when I started to learn about the mistake, I realized that I have not searched anything about the company and made the decision based on my friend saying. I contributed beyond what I could bear to lose. The worst part that I had no idea about candlestick patterns like Hammer or Doji for the trading and lose all the capital.
Hammer Candlestick:
Let’s discuss hammer candlestick first. First we will discuss what is hammer? Then we will explain how to use hammer for trading.
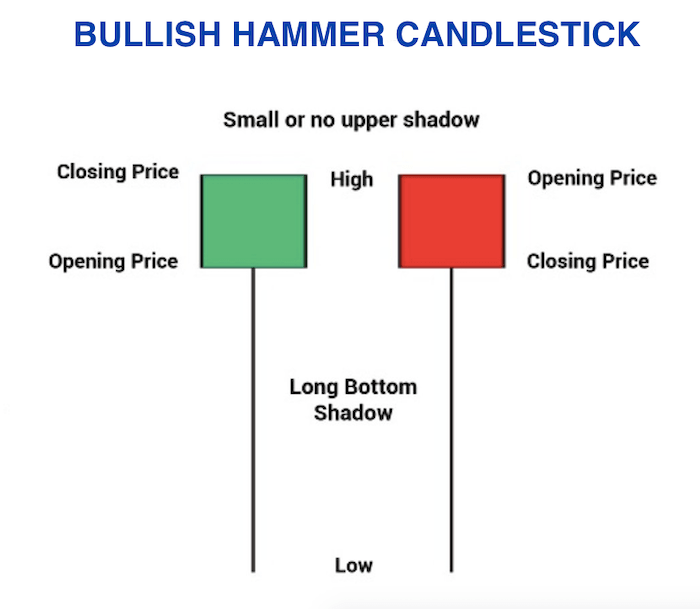
In candlestick charting, hammer is a price pattern which occurs when price is getting low than its opening price and rallies within the period to close to its opening price. The pattern forms the hammer-shaped candlestick in which the shadow at least twice the candle body. The body represents the difference between opening and closing prices and shadow represents the high and low price for the period.
Point you should remember:
- Hammer occurs after the price decline and has a small body with large shadow.
- The closing value can be above or low the opening value. The close should be near the open so that the body of the candlestick remain small.
- The hammer indicates the price reversal to the upside. The price must start moving up following the hammer, it is called confirmation.
How investors use Hammer for trading:
Hammer signals price reversal to the upside. Confirmation come on the next candle. Traders usually buy stocks in the next candle. A stop loss placed below the low of the hammer or below the real body if the price is moving aggressively higher during the confirmation candle.
Rule to follow:
- If hammer comes in the support in the uptrend mode, it’s a strong bullish signal.
- If the resistance breaks with hammer candle with high volume, it’s a strong bullish signal. Make sure the trend is upward.
[articleAdToAppear]
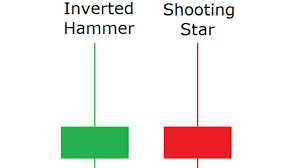
Shooting Star or Inverted Hammer :
The shooting star is a bearish reversal pattern that occurs at the top of an uptrend. It is characterized by a small real body (or no real body at all) and a long upper shadow that is at least two times the length of the real body. The lower shadow is typically very small or non-existent.
The shooting star suggests that the market has attempted to push higher, but has failed to maintain momentum and has been met with selling pressure. This can indicate a shift in sentiment among market participants and a potential reversal in trend.
It is important to note, however, that the shooting star pattern should not be relied on in isolation. Traders should always look for confirmation of a reversal through other technical indicators or fundamental analysis.
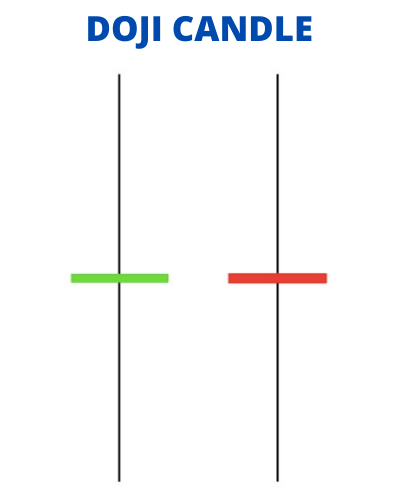
Doji Candlestick:
Doji is another type of candlestick that has small body. It signals indecision because it has both upper and lower shadow. Doji signals a price reversal or trend continuous based on the confirmation that follows. The main difference between hammer and doji is that hammer occurs after price decline and refers potential price reversal upside ad it has only lower shadow. Doji basically signals choppy market i.e. wait and watch situation.
Difference between Hammer and Doji and Shooting Star:
Hammer, doji, and shooting star are three distinct candlestick patterns that traders use to interpret market sentiment and potential price movements. While they share some similarities, each pattern has unique characteristics that differentiate it from the others.
Hammer:
The hammer suggests that the market has tested a new low, but buyers have stepped in to push prices back up, indicating a potential trend reversal. The long lower shadow shows that buyers have rejected lower prices, creating a support level at or near the candlestick’s low.
Doji:
The presence of a doji suggests that neither buyers nor sellers have control over the market, leading to a potential price reversal. However, traders often wait for confirmation of a reversal before taking any trading actions.
Shooting Star:
The shooting star suggests that the market has attempted to push higher, but has failed to maintain momentum and has been met with selling pressure. This can indicate a shift in sentiment among market participants and a potential reversal in trend.
Conclusion:
In summary, the hammer and shooting star patterns are both reversal patterns, but the hammer is bullish and forms at the bottom of a downtrend, while the shooting star is bearish and forms at the top of an uptrend. The doji, on the other hand, indicates indecision in the market and can be either bullish or bearish.
Hope you understand the difference between Hammer and Doji and How investor will use for trading. If you wanna learn more on Hammer candlestick, Investopedia write a very good article on hammer. You can check it any time.
If you are interested to learn more about candlestick pattern, then read the following book. The best book on candlestick pattern.
This is time to implement hammer candlestick and doji to get the best profit from the market. Remember, knowledge is nothing without implementation. So implement and analyze market always so that you can maximize your profit from the market. Execution is the first step to success. Investing or trading a practical field so implement right now!
Frequently Asked Questions:
Q) What is a candlestick pattern?
A candlestick pattern is a visual representation of the price action of an asset over a given period. It is formed by plotting the opening, closing, high, and low prices of an asset in a specific period, usually one day or one hour. These patterns can be used to analyze the psychology of market participants and help predict future price movements.
Q) What is the significance of a bullish candlestick pattern?
A bullish candlestick pattern is a pattern that suggests that the price of an asset is likely to rise. It is characterized by a long lower shadow and a small real body, which indicates that buyers are in control and pushing the price up.
Q) How are candlestick patterns used in technical analysis?
Candlestick patterns are often used in technical analysis to identify potential trend reversals or continuation patterns. Traders use these patterns to identify potential buying or selling opportunities and to set stop-loss and take-profit orders.
Q) Can candlestick patterns be used for all financial instruments?
Yes, candlestick patterns can be used for all financial instruments, including stocks, forex, commodities, and cryptocurrencies. However, it is important to remember that different assets and markets may have their own unique patterns and characteristics.
Q) Can candlestick patterns predict market movements accurately?
While candlestick patterns can be useful in predicting market movements, they are not always accurate. It is important to use other technical analysis tools, as well as fundamental analysis, to confirm the signals provided by candlestick patterns before making any trading decisions.
[multiplexAdToAppear]